2022-12-12
Torsten Asmus/iStock via Getty Images
Introduction
It is never a good idea to fall in love with a stock, but this one is one of our favourites. We first wrote about this company on 25th June 2006 and have traded it ever since then. However sometimes we make a conscious decision to invest in a stock and occasionally we have a stock thrust upon us by the merger and acquisitions route.
As you may already know, I became a shareholder in Kirkland Lake Gold Limited (KL) [TSX:KL] due to their takeover of Detour Gold Corp. (OTCPK:DRGDF) on 12th February, 2020. I took the view that the acquisition of Detour Gold Corp. was a good one and so decided to hold the stock and monitor the company’s performance as I thought highly of both of them.
On the 8th February 2022 Agnico Eagle Mines Limited (NYSE:AEM) (TSX:AEM:CA) and Kirkland Lake Gold Ltd. announced the successful completion of their merger, so I am now a proud of owner of one of this sector’s top quality companies.
A stock as popular as this one is usually well supported and therefore fairly priced and, hence, I struggled to find a ‘bargain’ entry level, so I wasn’t a stockholder at the time of the merger.
We will start today with a quick look at the chart of the underlying commodity: gold.
Gold popped above the $2000 level in March of this year. Since then, it has spent most of its time in a downward trend forming a number of lower highs
However, in November it would appear to have bottomed and commenced a new upward trend to higher ground forming two new higher highs over the last two months. This increase in value of around $175/Oz is course great news for companies such as Agnico Eagle Mines.
Gold Chart 12 Months (StockCharts)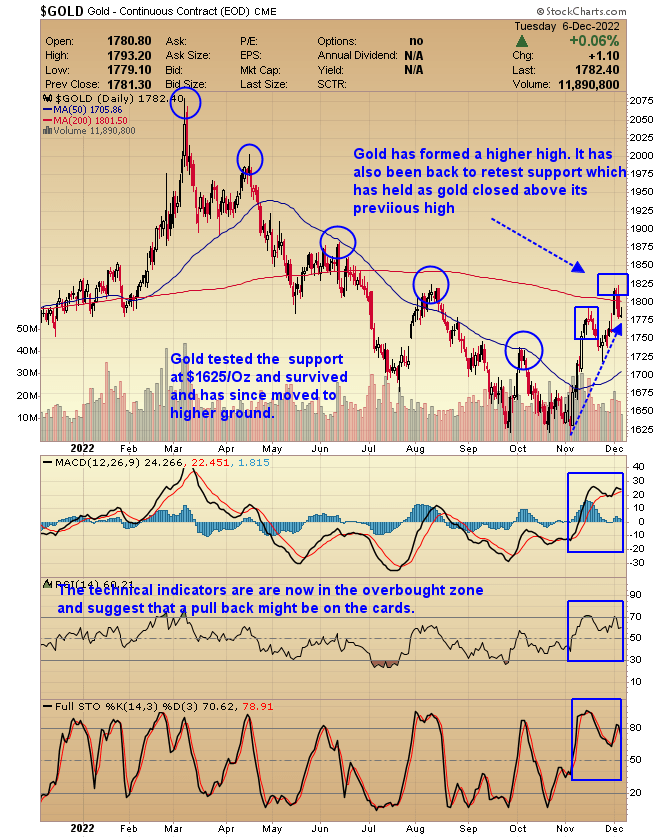
Agnico Eagle Mines: Brief Description
Agnico Eagle Mines is a Large Cap Canadian gold mining company conducting business in Canada, Mexico, Australia, and Finland. The Company has been in existence for 65 years and has declared a cash dividend every year since 1983. The dividend has been a tad miserly in the lean years, but which is still an achievement especially when compared to others in this sector that were unable to pay a dividend.
The following chart reflects the white-knuckle ride that Agnico Eagle Mines has experienced this year, from a high of $67.14 to a low of $36.69 and more recently to trade at around $50.00. What pleases me is that gold has risen 10% and Agnico has risen 25% since the beginning of November, so the correlation is 2.5X that of the price of gold in percentage terms
Agnico-Eagle Mines Limited 12 Months (StockCharts)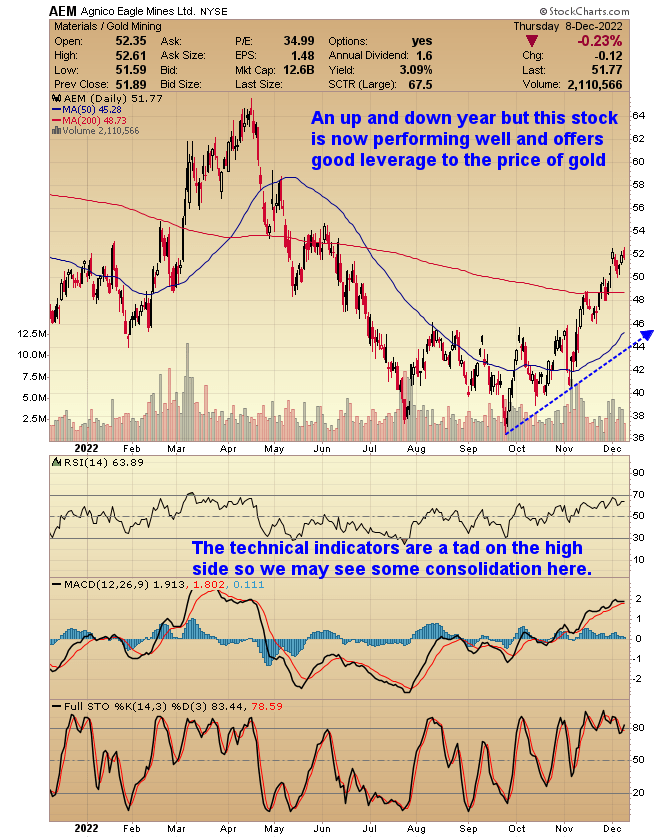
An up and down year and not one for the faint hearted, but this stock is now performing well and offers good leverage to the price of gold. The technical indicators are a tad on the high side so we may see some consolidation here. As we can see the RSI is close to ’70’ which if breached usually suggests that a reversal in the near term is on the cards.
Financials
Agnico has a market capitalization of $23.752B, a 52-week trading range of $36.69-$67.14, a P/E Ratio (TTM) of 36.54 and an EPS (TTM) of 1.42. The liquidity is good with an average Volume 3,164,165 shares traded per day enabling speculators to enter and exit this stock with ease.
This company is quoted on both the NYSE under the ticker symbol of AEM and on the Toronto Stock Exchange under the symbol of AEM.TO.
In a news release in October Agnico stated that in the third quarter the all-in sustaining costs (“AISC”) per ounce was $1,106. In simplistic terms it could be argued that as gold is trading at around $1800/Oz, Agnico is making $700/Oz. Now if gold does find some traction and rallies to the $2000/Oz level, then Agnico will be making $900/Oz, an increase of 28% over the current figures which should see it soar like the Eagle.
However, there is still the tricky problem of inflation to factor into the cost of doing business. The mining industry is a big user of energy which is costly and Agnico also mentioned the cost of steel when referencing inflation. As far as we can ascertain inflation in Canada is running at 6.88% as recently reported by Reuters and depicted on the chart below.
Bank of Canada makes big rate hike, hints it may the last one
Inflation In Canada (Reuters)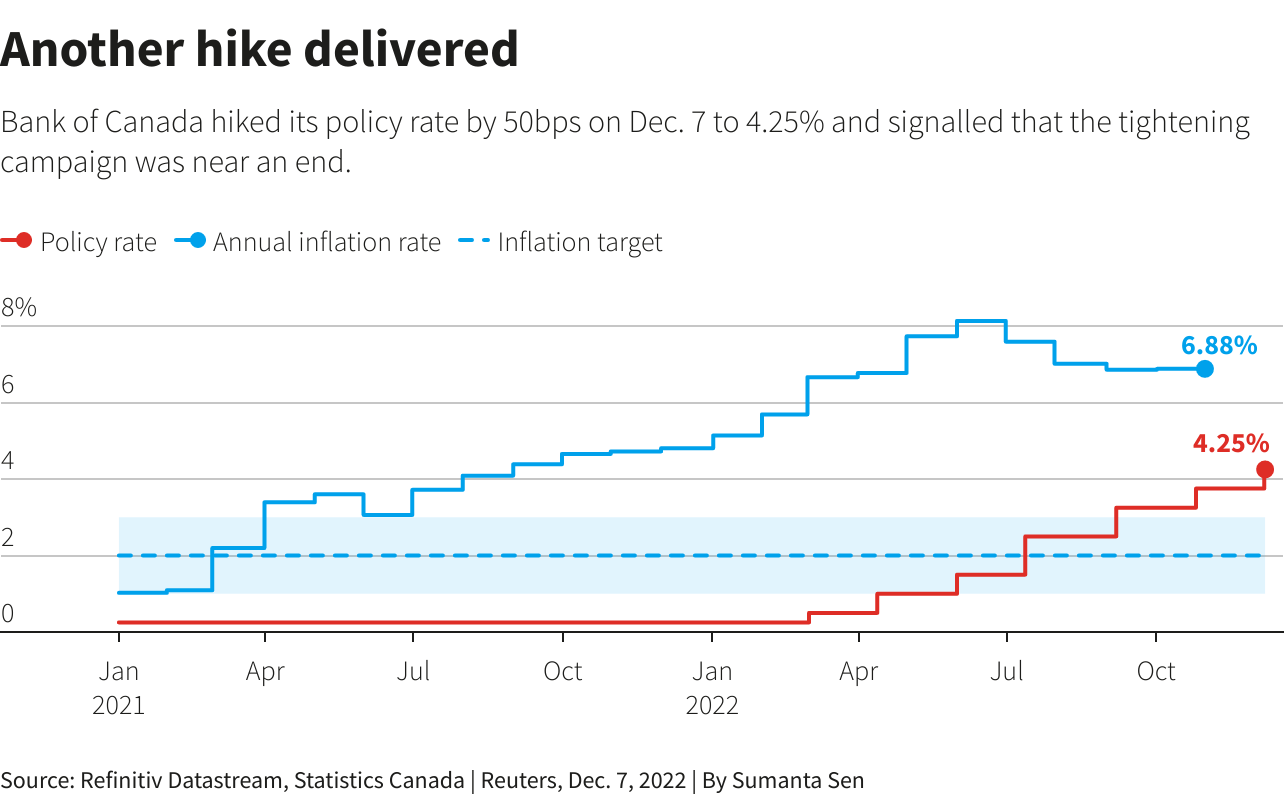
Agnico declared a quarterly dividend of $0.40 per share which is encouraging for those investors seeking an income from their investments, however, it is the possibility of a considerable capital gain that interests me, being a gold bug at heart.
If we take a quick look at some of the company’s competitors in the gold mining space, we can see that Agnico compares favorably against Newmont Corporation (NEM), Barrick Gold (GOLD), and two of the mining investment funds, VanEck Gold Miners ETF (GDX) and VanEck Junior Gold Miners ETF (GDXJ).
This comparison is for the last twelve months only, and different timescales will produce different outcomes. However when doing the same exercise for both a one-month period and a six-month time period, Agnico Eagle Mines still came out on top.
Agnico-Eagle Compared With Other Miners (Google Finance)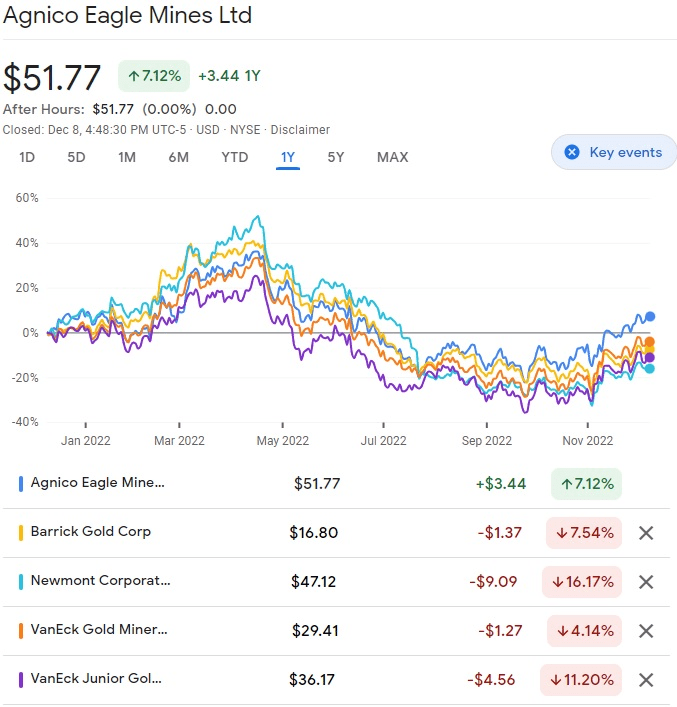
Conclusion
The S&P 500 has experienced some selling pressure along with the crypto market where the cryptos have been battered so investors should be looking at possible alternative investment vehicles. The precious metals sector is one of them and the next big rally may have already commenced.
The US dollar has gained in strength due to an aggressive rate hiking policy which looks to be coming to an end. Those investors who have a large allocation in cash may also be looking for the next opportunity to turn a profit and again the precious metals sector should catch their eyes as it is on the rise.
Investors looking for leverage to the price of gold should give Agnico Eagle Mines some serious consideration as I believe that it is one of the best in this sector.