2022-03-09 05:02:36
WHITE ROCK, BC / ACCESSWIRE / March 9, 2022 / TDG Gold Corp. (TSXV:TDG) (the “Company” or “TDG”) is pleased to report results from seven (7) diamond drillholes completed within the Creek and JM Zones at TDG’s former producing Shasta gold-silver (“Au-Ag”) project in the Toodoggone District, B.C.
DDH SH21-025 intersected: 73.66 metres (“m”) of 1.06 grams per tonne (“g/t”) Au and 29 g/t Ag from 60.8 m depth; including, 21.66 m of 2.62 g/t Au and 75 g/t Ag [3.56 g/t AuEq*]
Other key intercepts are summarised in Table 1 and include SH21-017 which intercepted 58.9 m of 0.70 g/t Au and 39 g/t Ag [1.18 g/t AuEq*] from 35.4 m depth. Cross sections are provided in Figures 2-4 of this news release.
Assay results were received from SGS Labs Canada (“SGS“). Internal QA/QC review by TDG, working with Moose Mountain Technical Services (“MMTS“), is ongoing and therefore results are still considered preliminary.
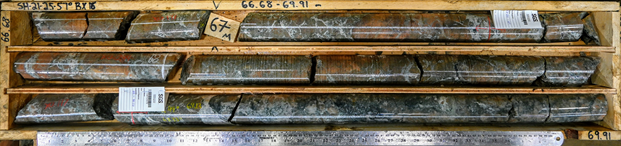 Image 1. Shasta drillhole SH21-025; mineralization encountered grading 5.61 g/t Au and 196 g/t Ag over 1.5 m from 67.5 m to 69.0 m depth.
The drillholes encountering the high-grade mineralization are within a package of volcanic dominantly crystal, subordinately ash tuffs, with increasing quartz/carbonate vein density approaching the high-grade intercepts, where multi-generation vein density increases and complete hydrothermal brecciation occurs. Mineralization is quartz/carbonate veins and veinlets carrying visible sulphides of pyrite, and appreciable acanthite (silvery veins, bottom of Image 1).
Steven Kramar, TDG’s Senior Geologist and B.C. Program Lead, commented: “A conceptual pit was created using historical data to outline a mining scenario and to guide the 2021 drilling. The results of seven drillholes published today have demonstrated that there is mineralized material below the conceptual pit, and the Shasta system is deeper than historical drilling tested. This is important as it presents the opportunity that the mineralized footprint at Shasta is larger than anticipated.”
TDG’s February 22, 2022, news release (available here) demonstrated continuity of mineralization across and between the two main mineralized target zones at Shasta. The assay results from the 7 drillholes contained within this news release show that the continuity of mineralization between the zones continues northwards within these zones and, furthermore, underlines TDG’s concept that the main zones at Shasta represent a “homogeneous mineralized body” in addition to discrete, structurally controlled pods of gold-silver mineralization.
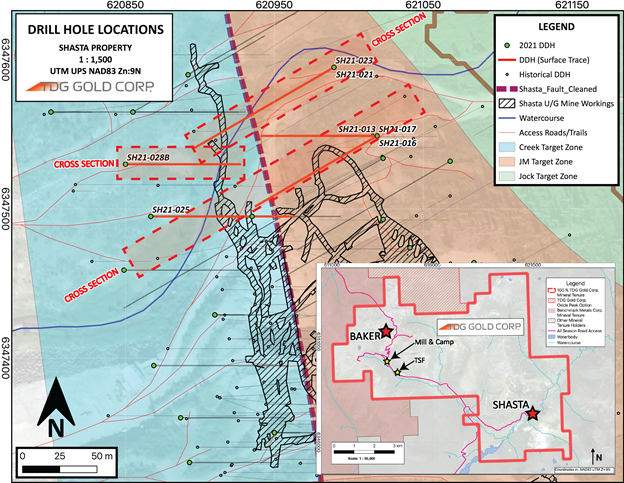 Figure 1. Plan Map of the JM and Creek Zones.
Table 1. Significant Results from the 2021 Drilling within and across the Creek and JM Zones.
|
Hole
|
Section
|
From
|
To
|
Length
|
Au
|
Ag
|
AuEq*
|
|---|---|---|---|---|---|---|---|
|
|
|
(m)
|
(m)
|
(m)
|
(g/t)
|
(g/t)
|
(g/t)
|
| SH21-013 |
5186662
|
75.0
|
83.0
|
8.0
|
0.43
|
23
|
0.72
|
|
and
|
|
103.0
|
109.0
|
6.0
|
1.01
|
11
|
1.15
|
| SH21-016 |
5186662
|
55.7
|
129.6
|
74.0
|
0.49
|
8
|
0.59
|
|
and
|
|
146.0
|
154.6
|
8.6
|
0.67
|
1
|
0.69
|
| SH21-017 |
5186662
|
35.2
|
94.0
|
58.9
|
0.70
|
39
|
1.18
|
|
and
|
|
109.5
|
132.0
|
22.5
|
0.42
|
20
|
0.66
|
| SH21-021 |
5186712
|
18.5
|
162.4
|
143.9
|
0.33
|
10
|
0.45
|
|
incl
|
37.5
|
50.3
|
12.8
|
0.46
|
11
|
0.60
|
|
|
incl
|
|
61.0
|
62.5
|
1.5
|
3.78
|
161
|
5.79
|
|
incl
|
|
71.5
|
81.0
|
9.5
|
0.38
|
10
|
0.51
|
|
incl
|
|
94.5
|
102.0
|
7.5
|
0.86
|
33
|
1.28
|
|
incl
|
|
134.5
|
145.0
|
10.5
|
0.80
|
15
|
0.99
|
| SH21-023 |
5186712
|
15.0
|
104.0
|
89.0
|
0.27
|
9
|
0.38
|
|
incl
|
15.0
|
23.5
|
8.5
|
0.29
|
17
|
0.51
|
|
|
incl
|
|
35.3
|
80.0
|
44.8
|
0.38
|
9
|
0.50
|
|
incl
|
|
55.0
|
59.3
|
4.3
|
1.74
|
33
|
2.15
|
| SH21-025 |
5186662
|
60.84
|
134.5
|
73.66
|
1.06
|
29
|
1.43
|
|
incl
|
|
60.84
|
82.5
|
21.66
|
2.62
|
75
|
3.56
|
| SH21-028B |
6347540
|
68
|
140.16
|
72.16
|
0.20
|
10
|
0.32
|
|
incl
|
68
|
90.7
|
22.7
|
0.30
|
19
|
0.54
|
|
|
incl
|
118.05
|
140.16
|
22.11
|
0.22
|
7
|
0.30
|
|
| *Gold equivalent (AuEq) is used for illustrative purposes, to express the combined value of Au and Ag as a percentage of Au. Calculations are uncut and no allowances have been made to accommodate potential recovery losses that would occur in a mining scenario. AuEq is calculated using 80:1 silver to gold ratio. Composite results were built using a 0.1 g/t AuEq cut-off, although there are intervals within the composites below 0.1g/t AuEq. | |||||||
| ** Intervals are core-length weighted. True width is estimated between 75 to 95 % of core length, and core recovery is calculated to be > 90 %. | |||||||
| ***Calculated composites are truncated to significant 2 digits for Au/AuEq and the nearest whole number for Ag. | |||||||
Significant intercepts from historical holes adjacent to 2021 drillholes are presented in Table 2.
Table 2. Significant Historical Results from the JM to Shasta Target Zone.
|
Drillhole
|
%
|
From
|
To
|
Length
|
Au
|
Ag
|
AuEq**
|
|
|
Assayed*
|
(m)
|
(m)
|
(m)
|
(g/t)
|
(g/t)
|
(g/t)
|
| SH84-01 |
51
|
9.3
|
47.5
|
38.2
|
0.87
|
46
|
1.45
|
| SH84-16 |
N/A (Hole Mostly Off of Cross Section)
|
||||||
| SH84-17 |
N/A (Hole Mostly Off of Cross Section)
|
||||||
| SH87-10 |
69
|
14.2
|
84.0
|
69.8
|
0.74
|
39
|
1.22
|
| SH87-21 |
78
|
55.6
|
79.9
|
24.3
|
0.64
|
15
|
0.83
|
| SH88-04 |
41
|
59.6
|
67.9
|
8.3
|
0.48
|
9
|
0.60
|
| SH88-16 |
N/A (Hole Mostly Off of Cross Section)
|
||||||
| SH89-37 |
N/A (Hole Mostly Off of Cross Section)
|
||||||
| SH89-038 |
46
|
10.8
|
16.1
|
5.3
|
1.18
|
48
|
1.78
|
| and |
188.8
|
191.8
|
3.0
|
0.62
|
25
|
0.93
|
|
| and |
195.7
|
197.8
|
2.1
|
1.21
|
17
|
1.42
|
|
| SH89-039 |
62
|
33.6
|
77.0
|
43.4
|
0.42
|
26
|
0.74
|
| incl |
56.0
|
67.0
|
11.0
|
0.85
|
42
|
1.37
|
|
| SH89-40 |
43
|
71.0
|
108.0
|
37.0
|
1.84
|
106
|
3.16
|
| SH89-44 |
54
|
121.7
|
131.2
|
9.5
|
1.22
|
42
|
1.75
|
| SH90-10 |
44
|
117.0
|
118.0
|
1.0
|
0.64
|
2
|
0.67
|
| SH90-22 |
20
|
142.6
|
146.5
|
3.9
|
0.87
|
24
|
1.17
|
| SH90-24 |
25
|
130.5
|
142.5
|
12.0
|
1.72
|
19
|
1.96
|
| SH91-07 |
19
|
82.0
|
99.4
|
17.4
|
0.97
|
37
|
1.44
|
| and |
113.1
|
119.5
|
6.4
|
0.75
|
17
|
0.96
|
|
| SH91-08 |
16
|
81.4
|
96.3
|
14.9
|
2.28
|
91
|
3.41
|
| SH91-09 |
12
|
78.3
|
79.9
|
1.5
|
1.09
|
45
|
1.66
|
| and |
84.4
|
88.7
|
4.3
|
0.68
|
31
|
1.06
|
|
| SH91-10 |
16
|
19.1
|
26.7
|
7.6
|
0.38
|
26
|
0.70
|
| SH91-12 |
17
|
46.3
|
63.1
|
16.8
|
0.51
|
18
|
0.73
|
| SH91-13 |
19
|
35.4
|
40.1
|
4.7
|
0.62
|
46
|
1.19
|
| and |
54.0
|
57.0
|
3.1
|
2.12
|
123
|
3.66
|
|
| * “% Assayed” is the assayed portion of the drillhole in the historical database compared to total length | |||||||
| **Gold equivalent (AuEq) is used for illustrative purposes, to express the combined value of Au and Ag as a percentage of Au. Calculations are uncut and no allowances have been made to accommodate potential recovery losses that would occur in a mining scenario. AuEq is calculated using 80:1 silver to gold ratio. Composite results were built using a 0.1 g/t AuEq cut-off, although there are intervals within the composites below 0.1g/t AuEq. | |||||||
| *** Intervals are core-length weighted. True width and core recovery is calculated is unknown. | |||||||
| ****Calculated composites are truncated to significant 2 digits for Au/AuEq and the nearest whole number for Ag. | |||||||
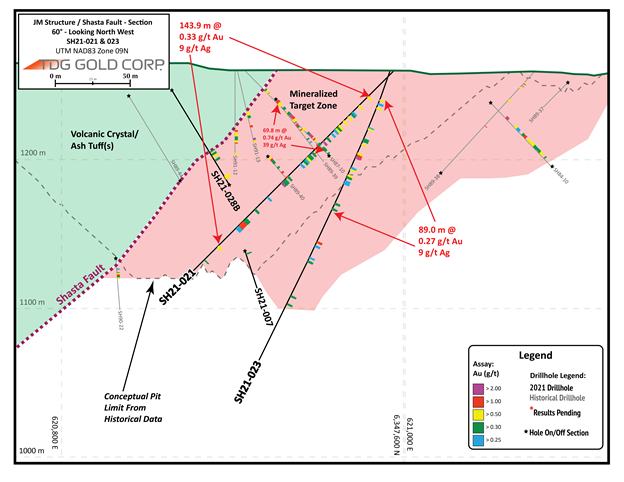 Figure 2. Section 5186712, Drillholes SH21-021 & SH21-023. (*Most Northern Section Displayed on Figure 1)
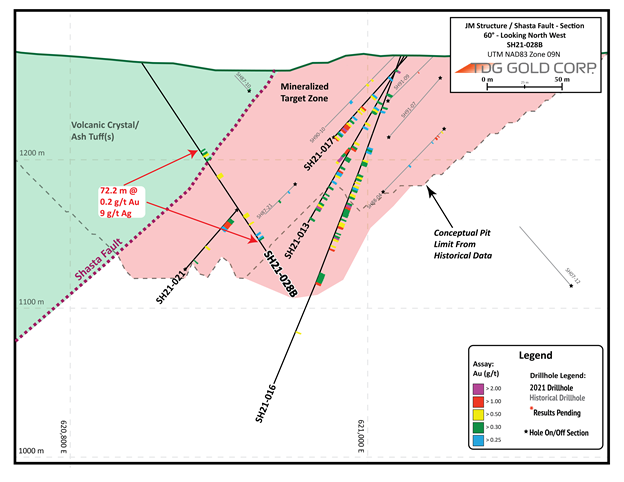 Figure 3. Section 6347540, Drillhole SH21-028B. (*Central Section Displayed on Figure 1)
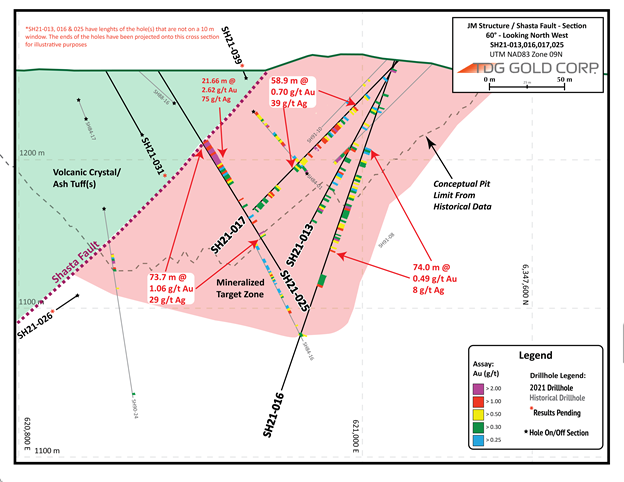 Figure 4. Section 5186662, Drillholes SH21-013, SH21-016, SH21-017 & SH21-025. (*Most Southern Section Displayed on Figure 1)
All 2021 drill holes were HQ sized drill cores. Particulars for drillholes (location, depth, etc.)are presented in Table 3.
Table 3. 2021 Drillhole Particulars.
|
HOLE
|
UTME (NAD83)
|
UTMN (NAD83)
|
Azimuth(°)
|
Dip(°)
|
Final Depth (m)
|
| SH21-013 |
621,019
|
6,347,549
|
270
|
-60
|
116
|
| SH21-016 |
621,019
|
6,347,549
|
270
|
-70
|
227
|
| SH21-017 |
621,019
|
6,347,549
|
240
|
-45
|
133
|
| SH21-021 |
620,990
|
6,347,595
|
240
|
-45
|
152
|
| SH21-023 |
620,990
|
6,347,595
|
240
|
-70
|
210
|
| SH21-025 |
620,867
|
6,347,495
|
90
|
-57
|
176
|
| SH21-028B |
620,850
|
6,347,530
|
90
|
-58
|
145
|
QA/QC
Samples for the Shasta 2021 drill program followed chain of custody between collection, processing and delivery to an SGS laboratory in Burnaby, B.C. The drill cores were delivered to the core shack at TDG’s Baker Mine site, and processed by geologists who inserted certified reference materials, blanks and duplicates (pulp and coarse) into the sampling sequence. The 2021 drill core was cut in half (1/2 HQ core) and placed in zip-tied polyurethane bags, then in security-sealed rice bags before being delivered directly from the Baker Mine site, to Bandstra Transportation Systems in Prince George, B.C., and ultimately to the SGS laboratory in Burnaby, B.C. Samples were prepared and analyzed following procedures summarized in Table 4, where information about methodology can be found on the SGS Canada Website, in the analytical guide (here).
Table 4. Au and Ag Analytical Methods.
|
Drillhole
|
Prep
|
Method Au
|
Method Ag
|
Method Au-Overlimit
|
Method Ag-Overlimit
|
| SH21-013 |
PRP89
|
GO_FAI50V10
|
GE_IMS40Q12
|
N/A
|
N/A
|
| SH21-016 |
PRP89
|
GO_FAI50V10
|
GE_IMS40Q12
|
N/A
|
GO_FAG37V
|
| SH21-017 |
PRP89
|
GO_FAI50V10
|
GE_IMS40Q12
|
N/A
|
GO_FAG37V
|
| SH21-021 |
PRP89
|
GO_FAI50V10
|
GE_IMS40Q12
|
N/A
|
N/A
|
| SH21-023 |
PRP89
|
GO_FAI50V10
|
GE_IMS40Q12
|
N/A
|
N/A
|
| SH21-025 |
PRP89
|
GO_FAI50V10
|
GE_IMS40Q12
|
N/A
|
GO_FAG37V
|
| SH21-028B |
PRP89
|
GO_FAI50V10
|
GE_IMS40Q12
|
N/A
|
N/A
|
Quality assurance and control (“QAQC“) is maintained internally at the lab through rigorous use of internal certified reference materials, blanks, and duplicates. An additional QAQC program was administered by TDG Gold through the use of certified reference materials (“CRMs“), duplicate samples and blank samples that were blindly inserted into the sample batch. If a QAQC sample returns an unacceptable value an investigation into the results is triggered and when deemed necessary, the samples that were tested in the batch with the failed QAQC sample are re-tested. For the purposes of this press release, results are ‘preliminary’ and thus have not undergone TDG’s comprehensive QAQC investigations.
Qualified Person
The technical content of this news release has been reviewed and approved by Steven Kramar, MSc., P.Geo., a qualified person as defined by National Instrument 43-101.
This news release includes historical drilling information that has been reviewed by the Company’s geological team. The Company’s review of the historical records and information reasonably substantiate the validity of the information presented in this news release; however, the Company cannot directly verify the accuracy of the historical data, including the procedures used for sample collection and analysis. Therefore, the Company encourages investors to exercise appropriate caution when evaluating these results. Further data review is underway, in order to verify the validity of the data for the anticipated NI 43-101 compliant mineral resource estimate.
About TDG Gold Corp.
TDG is a major mineral claim holder in the historical Toodoggone Production Corridor of north-central British Columbia, Canada, with over 23,000 hectares of brownfield and greenfield exploration opportunities under direct ownership or earn-in agreement. TDG’s flagship projects are the former producing, high grade gold-silver Shasta, Baker and Mets mines, which are all road accessible, produced intermittently between 1981-2012, and have over 65,000 m of historical drilling. In 2021, TDG advanced the projects through compilation of historical data, new geological mapping, geochemical and geophysical surveys, and, for Shasta, drill testing of the known mineralization occurrences and their extensions. TDG currently has 78,361,085 common shares issued and outstanding.
ON BEHALF OF THE BOARD
Fletcher Morgan
Chief Executive Officer
For further information contact:
TDG Gold Corp.,
Telephone: +1.604.536.2711
Email: This email address is being protected from spambots. You need JavaScript enabled to view it.
Neither TSX Venture Exchange nor its Regulation Services Provider (as that term is defined in the policies of the TSX Venture Exchange) accepts responsibility for the adequacy or accuracy of this release.
This news release contains forward-looking statements that are based on the Company’s current expectations and estimates. Forward-looking statements are frequently characterized by words such as “plan”, “expect”, “project”, “intend”, “believe”, “anticipate”, “estimate”, “suggest”, “indicate” and other similar words or statements that certain events or conditions “may” or “will” occur. Such forward-looking statements involve known and unknown risks, uncertainties and other factors that could cause actual events or results to differ materially from estimated or anticipated events or results implied or expressed in such forward-looking statements. Such factors include, among others: the actual results of current exploration activities; conclusions of economic evaluations; changes in project parameters as plans to continue to be refined; possible variations in ore grade or recovery rates; accidents, labour disputes and other risks of the mining industry; delays in obtaining governmental approvals or financing; and fluctuations in metal prices. There may be other factors that cause actions, events or results not to be as anticipated, estimated or intended. Any forward-looking statement speaks only as of the date on which it is made and, except as may be required by applicable securities laws, the Company disclaims any intent or obligation to update any forward-looking statement, whether as a result of new information, future events or results or otherwise. Forward-looking statements are not guarantees of future performance and accordingly undue reliance should not be put on such statements due to the inherent uncertainty therein.